
AI GPU Economics: How Quickly Can You Recover Costs?

TL;DR: AI GPUs are transforming infrastructure economics by reducing capital recovery timelines from 20–30 years to approximately 1–2 years. A modelled NVIDIA B300 GPU investment of around $65,000 can potentially recover its cost through rental revenue, depending on pricing and utilization. However, delivery delays, GPU depreciation, rising debt and fluctuating rental rates remain key risks. For AI infrastructure investors, timely deployment, sustained demand and strong operating cash flow are critical to achieving faster returns.
An AI GPU pays back in about one to two years. A modelled NVIDIA B300 GPU costs about US$65,000. At rental rates of US$5.00 to US$9.50 an hour, it recovers that cost in roughly 1 to 2 years. A toll road, port or airport takes 20 to 30 years or more. Delay is the main risk. A six-month delay adds about 30% to the payback. Schedule matters most.
How long does infrastructure normally take to pay back?
For almost every asset financed at scale, the answer has been a generation. Long contracts exist because recovery takes that long.
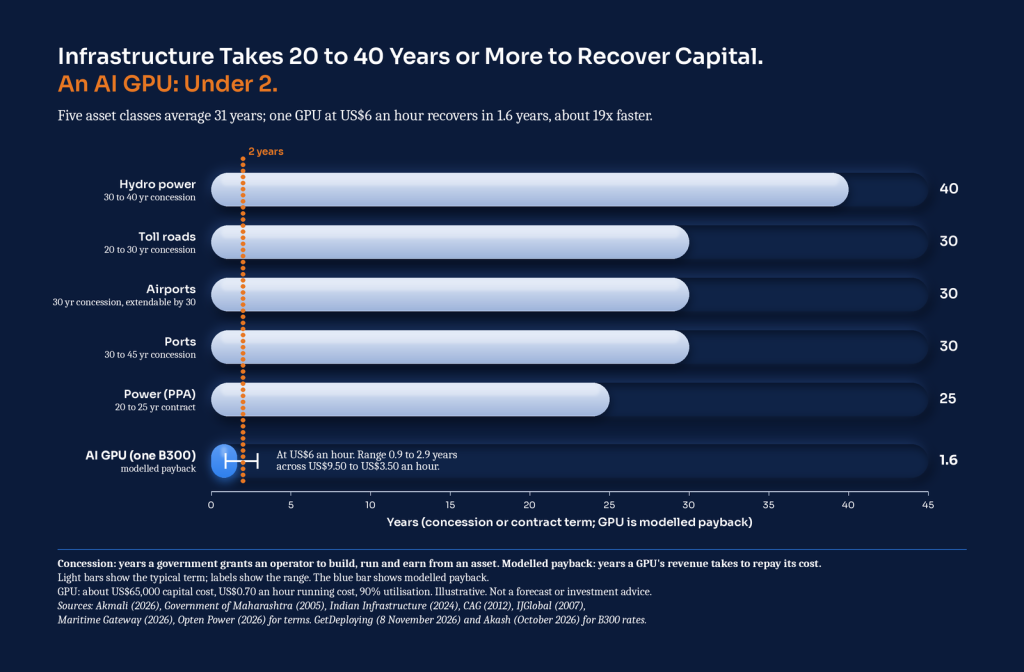
- Indian toll highway concessions run for 20 to 40 years under the revised model agreement (Indian Infrastructure, 2024).
- Port trust concessions are typically 30 years (Comptroller and Auditor General of India [CAG], 2012).
- The Delhi airport concession, awarded in 2006, runs for 30 years with an option to extend for another 30 (IJGlobal, 2007).
Image 1 compares these concession terms with one B300 GPU at modelled rates.
Image 1. Capital Recovery Time: Infrastructure Terms against one AI GPU
Source. Akmali (2026); CAG (2012); Government of Maharashtra (2005); IJGlobal (2007); Indian Infrastructure (2024); Maritime Gateway (2026); Opten Power (2026); GetDeploying (2026); Narahari (2026).
How long does it take for an AI GPU to pay back?
Take one NVIDIA B300 GPU. The card alone sells for about US$53,000 (Narahari, 2026). Adding a share of the server, networking and storage brings the modelled capital cost to about US$65,000.
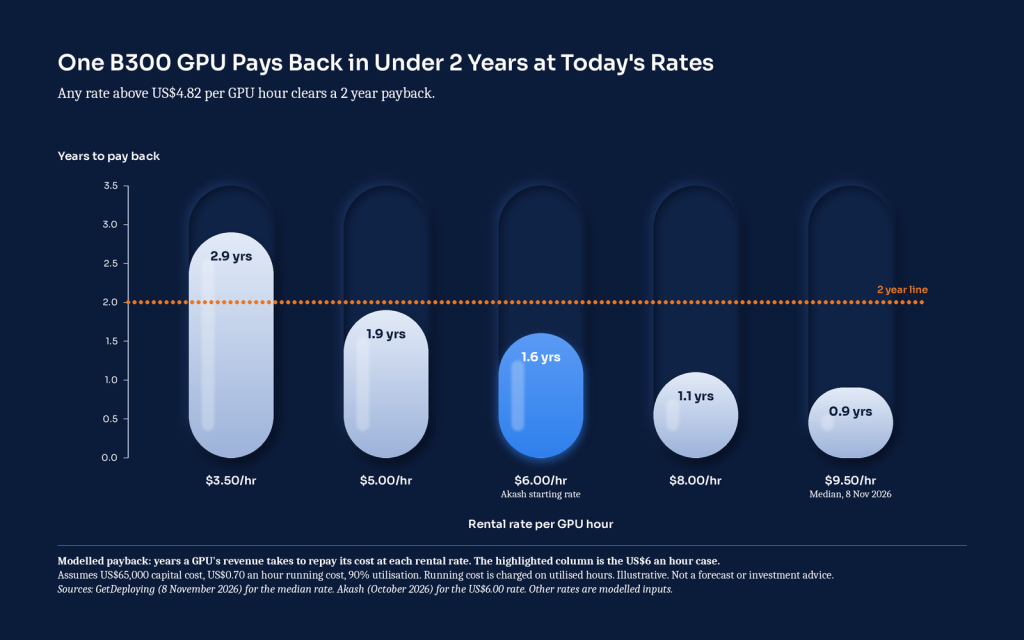
A two-year payback needs a rental rate of about US$4.82 an hour. Image 2 shows where each rate sits against that line.
Image 2. Years to pay back one B300 GPU at different rental rates
Source. GetDeploying (2026); Narahari (2026). Modelled inputs shown in the image.
Market rates sit above that line. The median on demand rate is US$9.50 an hour, up about 14% in 90 days. The lowest verified in stock price is US$7.10 (GetDeploying, 2026). One decentralised provider lists B300 capacity from US$6.00 an hour (Narahari, 2026). Rates move fast, so the risks section returns to pricing.
Why does removing one zero change the asset class?
A two-year GPU payback equals a gross cash yield of about 50% a year. A 20-year payback equals about 5%.
- A 20-year payback equals a gross cash yield of about 5% a year on capital deployed. A two-year payback equals about 50% a year.
- Both are simple ratios before depreciation, tax and financing costs. Neither is a return on equity.
- Capital that returns in two years can in principle be redeployed up to ten times in the 20 years a highway takes to recover its capital once.
- That needs demand, power and hardware supply to hold. The questions change to how fast GPU capacity arrives and how long rental rates hold.
Why is AI GPU payback so short?
Demand for GPU capacity is strong and rates have risen.
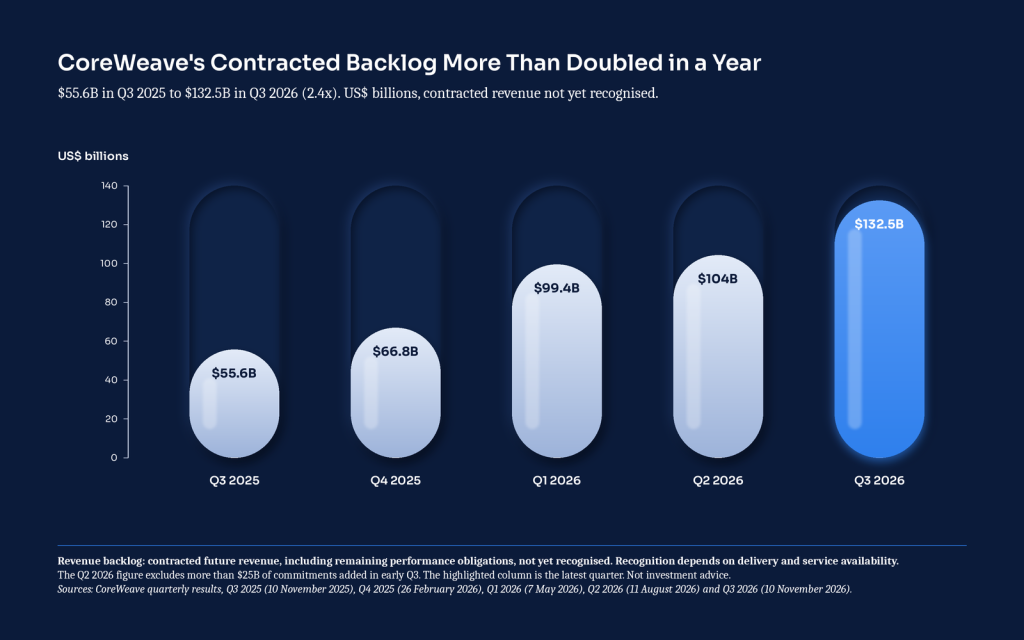
- CoreWeave, a listed AI cloud provider, reports a contracted revenue backlog of about US$133 billion, up 138% on a year earlier (CoreWeave, 2026b).
- It raised prices across its GPU range by about 25% in July, then by about 10% more later in the quarter (CoreWeave, 2026b).
- Prices for older Ampere and Hopper GPUs rose 30% to 50% quarter on quarter, above their original contract prices (CoreWeave, 2026b).
- Management describes a favourable demand and pricing environment (CoreWeave, 2026b).
- Higher rates shorten payback. Contracted backlog adds revenue visibility.
Image 3. CoreWeave contracted revenue backlog, Q3 2025 to Q3 2026
Source. CoreWeave (2025, 2026a, 2026b, 2026c, 2026d)
What does a six-month delay do to payback?
On a 30-year road, a six-month delay is a rounding error. On a two-year asset it is a different investment. Table 1 shows the arithmetic.
Table 1. Effect of a six-month delay on capital recovery
| Asset | Payback horizon | Delay | Horizon after delay | Increase |
| Toll highway concession | 30 years | 0.5 years | 30.5 years | 1.7% |
| AI GPU at US$6.00 an hour | 1.6 years | 0.5 years | 2.1 years | About 31% |
Note. Simple arithmetic. Highway term from Figure 1; GPU horizon from Figure 2. Illustrative.
The same six months that add under 2% to a highway horizon add about 31% to the GPU case. Delivery dates now decide returns. CoreWeave lowered its 2025 revenue guidance in November 2025 (CoreWeave, 2025).
Who carries the risk when payback falls from decades to two years?
The investor carries delivery risk over months. A concession investor carries policy risk over three decades.
- A 30-year concession exposes the investor to a government’s promises. Traffic assumptions must hold. Tariffs must be honoured. Policy must stay steady for three decades.
- A GPU build exposes the investor to a supplier’s delivery date, a utility’s power connection and a customer’s contract. The window is months.
- Delivery risk shows up in quarterly numbers, so investors can track it each quarter.
Why do GPU cloud companies still report losses?
CoreWeave’s Q3 2026 results show the early phase. Table 2 sets the quarter against the same quarter a year earlier. Revenue rose 168%.
Table 2. CoreWeave third quarter results, 2026 against 2025
| Measure | Q3 2026 | Q3 2025 |
| Revenue | US$3,661 million | US$1,365 million |
| Operating income | US$207 million | US$52 million |
| Adjusted EBITDA | US$2,256 million | US$838 million |
| Adjusted EBITDA margin | 62% | 61% |
| Interest expense, net | US$846 million | US$310 million |
| Net loss | US$709 million | US$110 million |
Source. CoreWeave (2026d).
Operating cash flow was about US$2 billion in the quarter. Total debt stands at nearly US$47 billion, excluding leases (CoreWeave, 2026d).
The loss follows a J curve. Cost comes first. Capacity arrives in stages. Revenue follows. A highway stretches that dip across two decades. A GPU fleet compresses it into about two years.
What could go wrong with GPU economics?
Delay is covered above. Three more risks matter.
- Asset life: Michael Burry argues GPU useful lives may be two to three years, against roughly six on hyperscaler books. He estimates US$176 billion of understated depreciation from 2026 to 2028 (Barchart, 2025a; Techstrong AI, 2025). Other analysts contest this. Bernstein’s Stacy Rasgon noted that five-year-old A100 GPUs still earn comfortable margins (Barchart, 2025b). A GPU that repays in under two years recovers its cost before even the sceptic’s life estimate ends.
- Debt: Debt raises the cost of delay. A short payback shortens the time exposed to rate and refinancing risk. It does not remove it.
- Rates: Rates can fall. Some analyses show on demand H100 prices falling (Barchart, 2025b). B300 rate roughly doubled in about six months to US$9.16 (8 November median: US$9.50) by October 2026 (Telnyx, 2026). The US$4.82 break even leaves headroom.
Should a two-year asset be judged by twenty-year instincts?
Investors accepted a twenty-year wait for infrastructure for over a century. A GPU asks for two. Three questions replace those instincts.
- Is capacity arriving on schedule?
- Are rental rates above the break-even line?
- Can operating cash flow carry the debt?
Early losses sit at the bottom of a J curve when the answers are yes. They are a warning when the answers are no.
Disclosure
Mr. Piyush Somani is Founder and CMD of ESDS Software Solution Ltd (NSE/BSE), which builds and operates AI infrastructure and has a commercial contract with a SharonAI subsidiary. This is my view of the sector, not investment advice. Payback figures are illustrative model outputs, not forecasts, and do not describe the operating or financial performance of ESDS. Third party data is cited as published and was accessed in November 2026.

A recognized industry voice, he has spoken at platforms including TEDx and has been featured in leading publications such as Forbes, The Economic Times and Business Standard. He is also the author of Entrepreneur with the Fire Within and Living in Harmony with the Sun.
- AI GPU Economics: How Quickly Can You Recover Costs? - November 13, 2026