What Is APM and Why It’s Critical for Modern Applications in 2026?
A customer taps “Pay Now.” The spinner runs for nine seconds. They close the app and don’t come back. Your servers reported 200 OK the whole time; no crash, no error. But you still lost the sale, and nobody knew until the revenue dashboard told the story a day later. This is the gap Application Performance Monitoring exists to close. In 2026, with applications spread across microservices, multi-cloud infrastructure, and AI-driven workloads, that gap has only gotten more expensive to ignore.
Here’s what APM actually is, why it’s become non-negotiable for engineering teams, and what to look for in a platform built for how applications run today.
What Is Application Performance Monitoring (APM)?
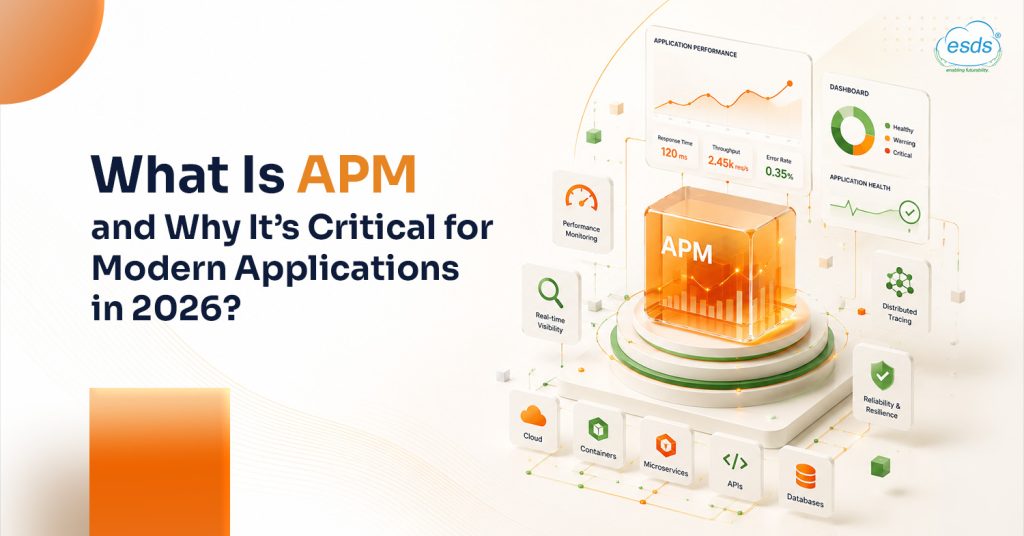
APM is the practice of tracking, measuring, and managing how a software application behaves in production. APM tools continuously collect data: response times, error rates, CPU and memory consumption, transaction throughput, and network latency, and present it so teams can act before users feel the impact.
Gartner frames APM as a suite of monitoring software covering digital experience monitoring, application discovery, tracing and diagnostics, and purpose-built AI for IT operations.
Why APM Is a Business Concern, Not Just an IT One?
Application performance stopped being a backend-only conversation once digital channels became the primary way customers transact. A few realities make this unavoidable in 2026:
- Slow apps cost revenue: A few seconds of latency is often enough to drive abandonment, and that shows up directly in conversion numbers, not just a support queue.
- Downtime costs more than the outage itself: Beyond the disruption, there’s engineering time spent diagnosing the issue, the support load it generates, and possible SLA penalties.
- Reactive operations don’t scale with complexity: Today’s stacks, microservices, containers, serverless functions, and third-party APIs generate far more telemetry and more ways to fail quietly than a monolithic application ever did. Waiting for users to report problems isn’t a viable model anymore.
Numbers Behind the Urgency
The business case for APM isn’t theoretical. A few figures sitting with:
- A one-second delay in page load can cut conversions by roughly 7%, along with a standing benchmark that still holds as user patience has only gotten thinner, not thicker.
- IT downtime now averages well over $14000 per minute for midsize and large organizations, according to 2024-2026 industry surveys, with more than 90% of midsize and large companies reporting that a single hour of downtime costs over $3,00,000.
- Enterprises using AI-driven observability report MTTR reductions in the 40-70% range, largely by replacing manual log correlation with automated, AI-assisted root cause analysis.
- Despite the investment in dashboards, only a small fraction of enterprise applications is end-to-end observability.
How APM Works: From Telemetry to Root Cause?
Most APM (Application Performance Management) platforms follow a similar process: agents collect metrics from servers, databases, APIs, containers, and user sessions. This telemetry is correlated so that a slow page load can be traced back to the specific query or service call causing it. Real-time analysis flags deviations from established baselines, and alerts are directed to the appropriate team through the right channel, rather than overwhelming everyone with notifications. Root cause analysis delves from the symptoms down to the exact service or code path responsible for the issue. Over time, the accumulated data reveals recurring bottlenecks that teams can address structurally, rather than just reactively.
The five elements that make this process effective are end-user experience monitoring, runtime architecture discovery, transaction profiling, component-level diagnostics, and analytics. These elements distinguish a genuinely useful APM deployment from a collection of disconnected metrics.
Key APM Metrics
| Sr.No | Metric | What it Tells You |
| 1 | Response time | What fast users actually experience when using your application. |
| 2 | Error rate | Whether code, infrastructure, or capacity issues are surfacing. |
| 3 | CPU & memory utilization | Whether you’re approaching a resource ceiling |
| 4 | Transaction throughput | How much load is your system handling |
| 5 | Uptime/availability | Whether you’re meeting SLA Commitments |
| 6 | Database query time | Whether the database is slowing everything downstream. |
| 7 | API latency | How dependent services affect overall performance. |
What “Good” APM Looks Like in 2026?
Several capabilities distinguish a modern APM platform from a legacy one:
- Full-stack visibility: It provides a unified view of application, infrastructure, database, container, and network telemetry, rather than relying on five disconnected dashboards.
- AI-driven root cause analysis: It delivers a clear, plain-language diagnosis quickly enough to be useful during an incident, rather than just identifying anomalies.
- Open standards over vendor lock-in: It offers Open Telemetry native ingestion and compatibility, ensuring that existing instrumentation continues to function seamlessly.
- Data sovereignty and control: as knowing the exact location of telemetry data is essential for regulated industries.
- Predictable economics: It ensures that visibility does not come with unexpected per-host billing costs that could result in budget surprises at renewal.
Where Enlight Garud Fits In?
Enlight Garud, ESDS’s Unified Application Performance & Observability Platform, addresses critical gaps in application monitoring. It combines application performance monitoring, infrastructure health, database insights, container and Kubernetes visibility, log aggregation, and AI-driven root cause analysis into a single platform spanning nine observability domains, ensuring no blind spots.
Key features include:
- AI-driven root cause analysis: It provides clear answers instead of just alerts, correlating signals across layers for quick diagnostics.
- Comprehensive database support: It supports PostgreSQL, MySQL, MSSQL, and Oracle, identifying slow queries and replication lag before they cause outages.
- Flexible deployment options: on-premises, in a sovereign cloud, or fully air-gapped, crucial for regulated industries where telemetry residency matters.
- Open ecosystem: With native integrations for OpenTelemetry, Prometheus, Grafana, Kafka, and Elasticsearch, enhancing existing tools without replacements.
Bottom Line
In 2026, APM (Application Performance Management) is essential for detecting performance issues before they affect customer satisfaction. With more distributed applications and AI-driven workloads, successful platforms will effectively correlate signals across the entire stack for quick insights.
If your team is relying on multiple dashboards to identify root causes, it’s time to rethink your strategy. This common issue is solvable.
Learn about full-stack observability by exploring Enlight Garud or contact ESDS today.

- What Is APM and Why It’s Critical for Modern Applications in 2026? - June 25, 2026
- What is AIOps & How Does it Work in Real-Word IT Environments? - June 15, 2026
- Why MeitY Empanelment Is Key to Sovereign Cloud in India? - June 12, 2026