Get Overview of Oracle Database in One Click
Overview section under Oracle application monitoring helps the user to take a quick audit of Oracle database, as it displays overall database details, connection statistics and user activity. The overview window also represents the database health, availability, today’s availability, uptime, last start and much more.

Overview of Application / Database
- Oracle Health
- Oracle Availability
- Todays Availability
- Listener Uptime
- Listener Last Start
- Database Sever Details
- Connection Time
- Concurrent Users Activity
View/Configure Tablespace Instantly
Tablespaces in Oracle database are comprised of one or more logical storage units. It is important for users to check how much space is currently in use because when space is full, further transactions stop. Tablespace collectively stores all the database information through which user can view one or more datafiles, check the actual capacity of Tablespace, actively monitor growth in Tablespace, and configure alarms by setting threshold conditions for health, consumption. Tablespace guides database administrators to take provisioning decisions on-the-go and take corrective actions when threshold configurations are violated.

Tablespace Details
- Total no. of table spaces created in Oracle
- Their respective names & allocated/ used sizing
- Health status
- Separate Tablespace wise alerts in configure alarm section of dashboard
- Alerts on basis of criticality of Tablespace
Data files Details
- Detailed Status of Data Files
- Health status
- Details of Data files on specific Tablespace
- Allocated/Used & free space in real-time
Tablespace Fragmentation
- Details of free chunks size, largest chunks size and fragmentation index of Tablespace.
Perform In-depth Analysis of Oracle Sessions
Sessions enables the user to perform an in-depth analysis of total sessions running in Oracle DB with individual statuses, CPU usage details, modules running on each session, wait time and more. Through session’s section, administrator comes to know about the number of authorized/unauthorized users connected to the system and sessions being utilized by each of them. App Monitoring notifies unwanted sessions running in the database, based on which users can decide to kill these sessions and in turn improve system performance.

Session Details
- Total running sessions in oracle DB
- Their respective status, machine & usernames
- Health status – Elapsed time , CPU used
- Physical & Logical reads, lockwait
- Module and Program running the session
Session Waits
- Detailed Status of Sessions in Wait
- Their wait type/classs
- Wait time in ms
- Seconds in wait from top to low
- Current state of session
Schedule Jobs & Back Ups effortlessly
Jobs & Back Ups allows you to do a status check of jobs scheduled in Oracle, as it presents noteworthy information like jobs and their run status with duration, failure/retry counts, elapsed time, etc. Basically, users get to know success ratio of scheduled workflows. Backups enables user to perform seamless backups as it notifies the user about session key, back up status and size, time taken to complete the backup, etc. Database administrators are alerted about system back up needs so that they can proactively plan for back up provisioning.

Schedule Job Details
- Details of currently scheduled jobs in Oracle
- Their respective job names & current status
- Last run status with its duration
- Last start date of Job & next run date
- Comments from database on job
Schedule Jobs Stats
- Run count, Failure count, Retry count, Elapsed time in ms
- Active State of Status/Restart
Backup Jobs Details
- Crucial info about backup jobs with info such as session key, type, start time, autobackup count.
- Status/Size/Time Taken of Critical Back Ups
SGA
Take a Tour of SGA Performance
SGA enables the user to view SGA performance through graphs and charts. The SGA (System Global Area) is an area of memory (RAM) allocated when an Oracle Instance starts up. The SGA's size and function are controlled by initialization (INIT.ORA or SPFILE) parameters. Through SGA, the user can view memory performance which is a critical aspect of systems, as transactions fail and sessions can’t be created once memory performance falls short. App Monitoring enables DBAs to operate on optimized memory levels as users are alerted about memory usage proactively. Users can set memory parameters, punch threshold at the right locations and decide about memory provisioning by taking a quick walk through of SGA performances.

SGA Details
- Buffer cache size
- Shared Pool Size
- RedoLog Buffer Size
- Fixed Area Size
- Java Pool size
- Large Pool Size
- Free Memory
- SGA Latches Hit Ratio
- SGA Shared Pool
- Reload Ratio
- SGA Shared Pool Free Percentage
SGA Performance
- Details Status of SGA Performance in rela-time graphs and percentage metrics
- Buffer hit ratio
- Data dictionary hit ratio
- Library hit ratio
Analyse PGA Performance
PGA allows users to get instant details of memory region that contains data and control information for server processes. PGA is a non-shared memory region created by Oracle when a server process is started.
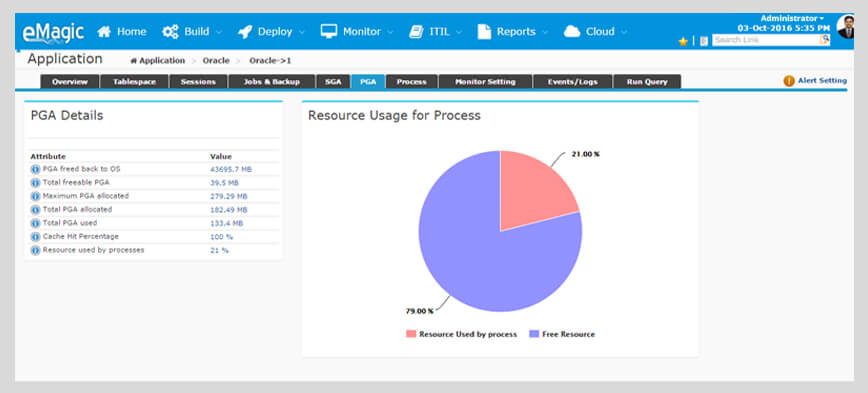
PGA Performance
- PGA freed back to OS
- Total freeable PGA
- Maximum PGA allocated
- Total PGA allocated
- Total PGA used
- Cache Hit Percentage
- Resource used by processes
Get Real-time Stats of Processes in Oracle
Process tab allows user to get instant access to processes running in Oracle, analyse consumption of PGA, learn about allocated and freeable PGA, etc. Users can take a detailed view of type of processes utilizing system resources and accordingly decide to stop/continue with processes as required.

Oracle Process
- All running process details
- Their respective Max. PGA used (in MB) wise bar graph
- detailed table report of real-time process stats
Set Threshold based Alerts Through Multiple Configurable Parameters
Monitor Setting in eMagic provides the user with multiple parameters to configure threshold based alerts on Oracle Database performance. Users can analyse historical data for each monitoring parameter represented in convenient graphical form, and edit settings in monitor conveniently.

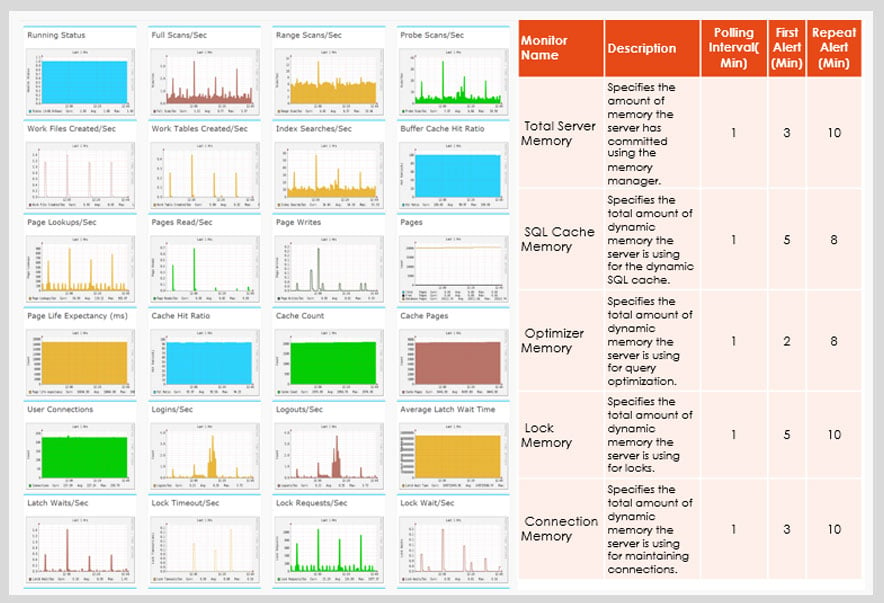
Monitoring Parameters Details
- 50+ Parameters are available for configuring threshold based alerts on Oracle Database performances
- Based on criticality of parameter; polling time, first alert time, repeated alert time can be defined for each parameter separately
- Historical data for each monitoring parameter is available in graphical form
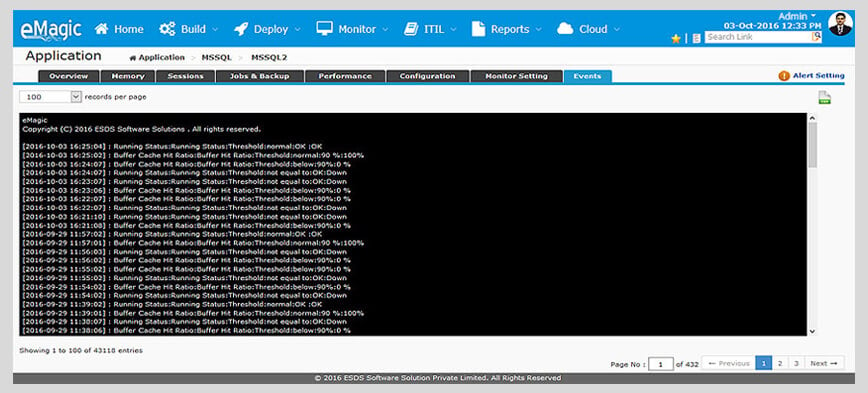
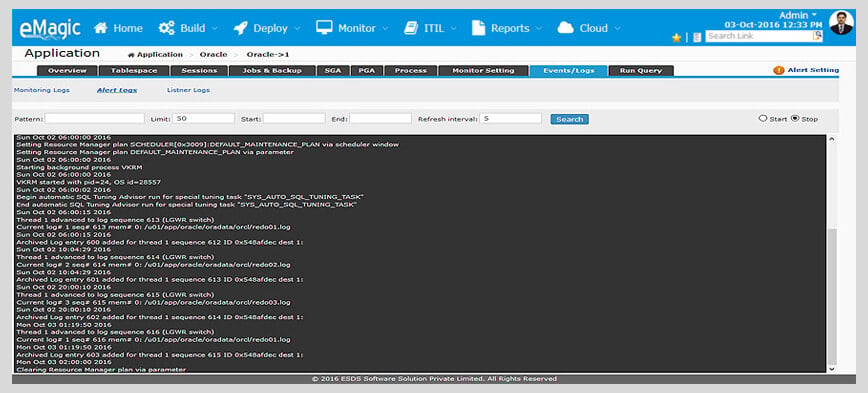
Get Access to Events/Logs
In Events and Logs, user can check monitoring alerts and notifications generated by App monitoring tool. It helps users to figure out exact time of events taking place.
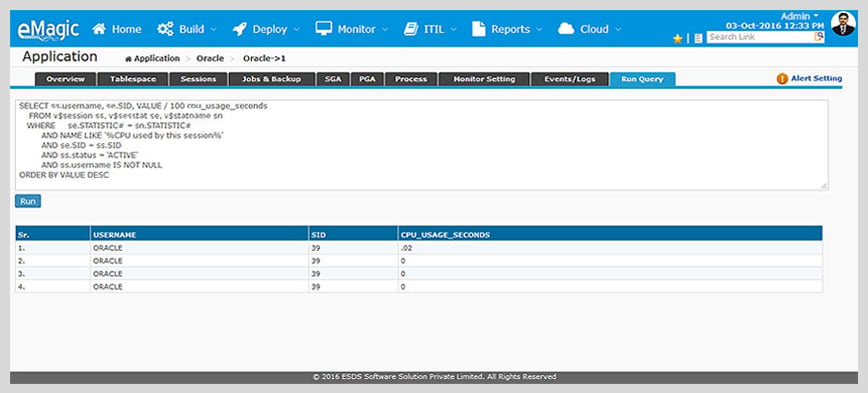
See Query Results in a Click
Run Query provides user a platform to execute any database Query and observe the Query results. It saves user's time to log into the system to execute any query.