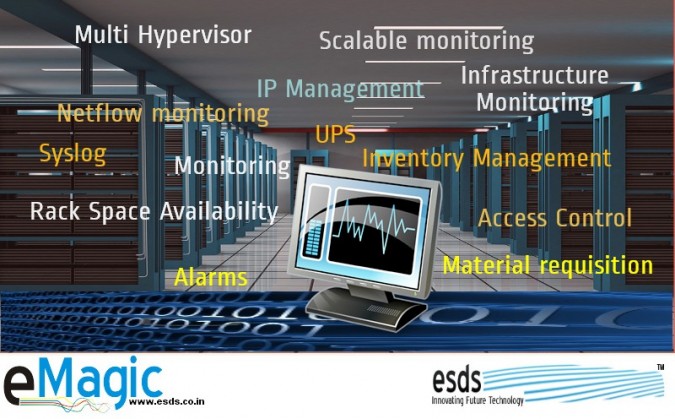
eMagic a Complete Datacenter Management Suite
eMagic is an one stop solution for automated datacenter management aspects, which makes data center management easy, quick and more efficient. A datacenter facilitated with eMagic can monitor server logs and consumption details with its friendly GUI.
With eMagic, you can handle all the aspects of data center management like trouble shooting, bandwidth consumption monitoring for an individual user as well as for the entire datacenter, OS installation and server reboots can be initiated with just a few clicks. If your datacenter is powered with eMagic, you can manage your entire datacenter without contacting system administrator or ESDS in order to address issues like – Reboot, Power on, KVMoIP, IP request. This is not all! eMagic is not limited with servers monitoring but also other network components like switches, routers, firewall. This also includes monitoring of Services and Performance parameters like RAM, CPU, Disk partitions, Disk IOPS, Power utilization, etc.
Auto Discovery of Network and Hardware – eMagic haves an unique feature which authorizes auto discovery of all devices in Network and their uplink – downlink connections, which can be operative through SNMP enabled network switches. In a result, the network monitoring becomes easier and ultimately simplifies your work tasks. As far as hardware discovery is concerned, the servers are auto discovered for their hardware components and are regularly audited for hardware configurations.
Scalable and Distributed Monitoring – eMagic facilitates Scalable and Distributed monitoring. This feature is supportive for monitoring a large number of devices, eMagic creates monitoring servers grid/cluster. These servers can be distributed geographically to monitor multiple datacentres which are distributed geographically.
As an outcome of comprehensive research and evolution, ESDS R&D Team came up with eMagic which enables an organization to manage, monitor and take corrective action for their datacenter in order to minimize error thus, saving cost and efforts.
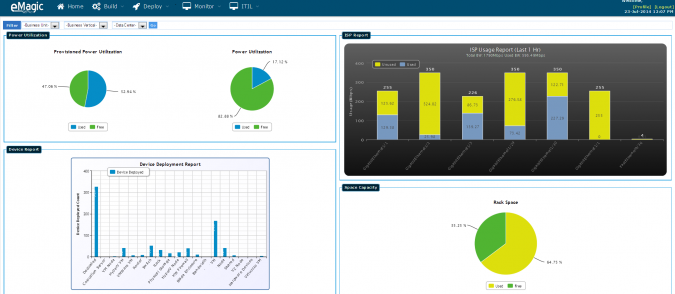
eMagic Dashboard
eMagic Dashboard provides a quick overview on the system and various components which includes information on ISP bandwidth, Power utilization, Rack Space availability, Device deployment, subnet report, Logs, System alerts etc. Also, the dashboard is fully customizable to include required information.
eMagic Modules:
Inventory Management: It provides a detailed report of available stock which can be allotted as per requirement. It detects the SNMP enabled devices on the network, provides ease to audit inventory and allotment, server assembly report etc. An user can manage wide range of IT components starting from cables, blade server to internal server components.
Monitoring: It helps to monitor services and ports. User can add N number of ports and services using monitoring settings. Device performance parameters like RAM, CPU, Temperature, Memory, Bandwidth, Max Bandwidth etc. can be easily monitored.
IP Management: It provides all information regarding IP allocation like Subnet report, conflict in IP, Blacklisted IP, and IP allocation report.
Netflow monitoring: This module analyses the router traffic and generates different reports which includes report on dashboard applications, IP and conversations.
Multi Hypervisor: Through this feature, now it is not a tough task for users to manage their virtual machines on cloud platforms like – Hyper-V, VMware , eNlight etc. eMagic supports virtualization VMware, Hyper-V, eNlight platforms where user can create and manage virtual machines from eMagic.
Change Management System (CMS): Within this feature, change request for each and every instance can be managed through an Instance log ID which is raised upon submitting the change request. Each change request ID is generated through a variety of means as a task record. These tasks can be assigned to appropriate change management team members, who will deal with the task as appropriate. Once the change has been properly implemented, it is closed.
Syslog: This feature is an enhancement for the monitoring of base log file and Custom text files for system and sends reminders once the threshold gets crossed via SMS, emails etc. Also, eMagic can monitor any text file using syslog monitoring
Material Requisition: In this module the user can integrate IT material purchased with inventory and operation. Also, inward and outward of IT assets can be managed.
eMagic Technical Specification:
PHP 5.x or more – eMagic user interface has been developed using PHP Framework.
Database Server – MySql
Perl 5.8.2 or more – All cron scripts are developed in Perl to achieve multithreading for fast execution of data fetching job from hundreds of servers.
SNMP – eMagic supports SNMP version 1, 2 and 3.
RRDTool – All monitoring graphs are generated using RRD Tool, there are many dependencies for installing RRD tool. For more details about installation on Linux please refer to the following link
http://www.cyberciti.biz/faq/howto-install-rrdtool-on-rhel-linux/
Power management utilities: IPMI / ILO – eMagic currently supports IPMI and ILO utilities With minor customization, eMagic can easily support other power management utilities
System Requirements:
Hardware –
- RAM: 2 GB (For 50 Interfaces)
- HDD : 10 GB
Software –
- OS: Linux CentOS, Ubuntu
- PHP 5.x +
- MySQL 5.0 +
- Fping
- RRDTool.
- SNMP Client
- Hping3
eMagic is available in two different editions from which you may select your desired edition depending upon your requirement.
The editions which we offer are as follows:
Standard Edition – IT monitoring for small to medium – sized organizations, backed by full support. It includes:
- Inventory Management
- Monitoring
- IP Management
- Netflow monitoring (Add-On)
- Multi Hypervisor (Add-On)
- CMS (Add-On)
- Syslog (Add-On)
Enterprise Edition – This includes monitoring large, complex and distributed IT environments with full service support. It includes:
- Inventory Management
- Monitoring
- IP Management
- Netflow monitoring
- Multi Hypervisor
- CMS
- Syslog
- Material requisition
- Distributed/Scalable monitoring
- Client Portal management
Resources:

- All you should know about Unified Payments Interface (UPI) - March 27, 2018
- eMagic a Complete Datacenter Management Suite - July 29, 2014